Access to Care in Deschutes County, Oregon
Medical costs in the United States are extremely high, so people without health insurance may not be able to afford medical treatment or prescription drugs. They are also less likely to get routine checkups and screenings, so if they do become ill they will not seek treatment until the condition is more advanced and therefore more difficult and costly to treat. Many small businesses are unable to offer health insurance to employees due to rising health insurance premiums.
The Healthy People 2020 national health target is to increase the proportion of people with health insurance to 100%. County: Deschutes Persons with Health Insurance
County: Deschutes Persons with Health Insurance
92.2%
(2021)
Compared to:


OR Counties
The distribution is based on data from 36 Oregon counties.
U.S. Counties
The distribution is based on data from 3,140 U.S. counties and county equivalents.
OR Value
(92.6%)
The regional value is compared to the Oregon State value.
Prior Value
(91.6%)
Prior Value compares a measured value with the previously measured value. Confidence intervals were taken into account in determining the direction of the comparison.
Trend
This comparison measures the indicator’s values over multiple time periods.<br>The Mann-Kendall Test for Statistical Significance is used to evaluate the trend<br>over 4 to 10 periods of measure, subject to data availability and comparability.
HP 2030 Target
(92.4%)
<div>AHS-01: Increase the proportion of people with health insurance <strong>(LEADING HEALTH INDICATOR)</strong></div>
This indicator shows the percentage of persons aged 0-64 years that have any type of health insurance coverage of the entire population.
Period of Measurement: 2020
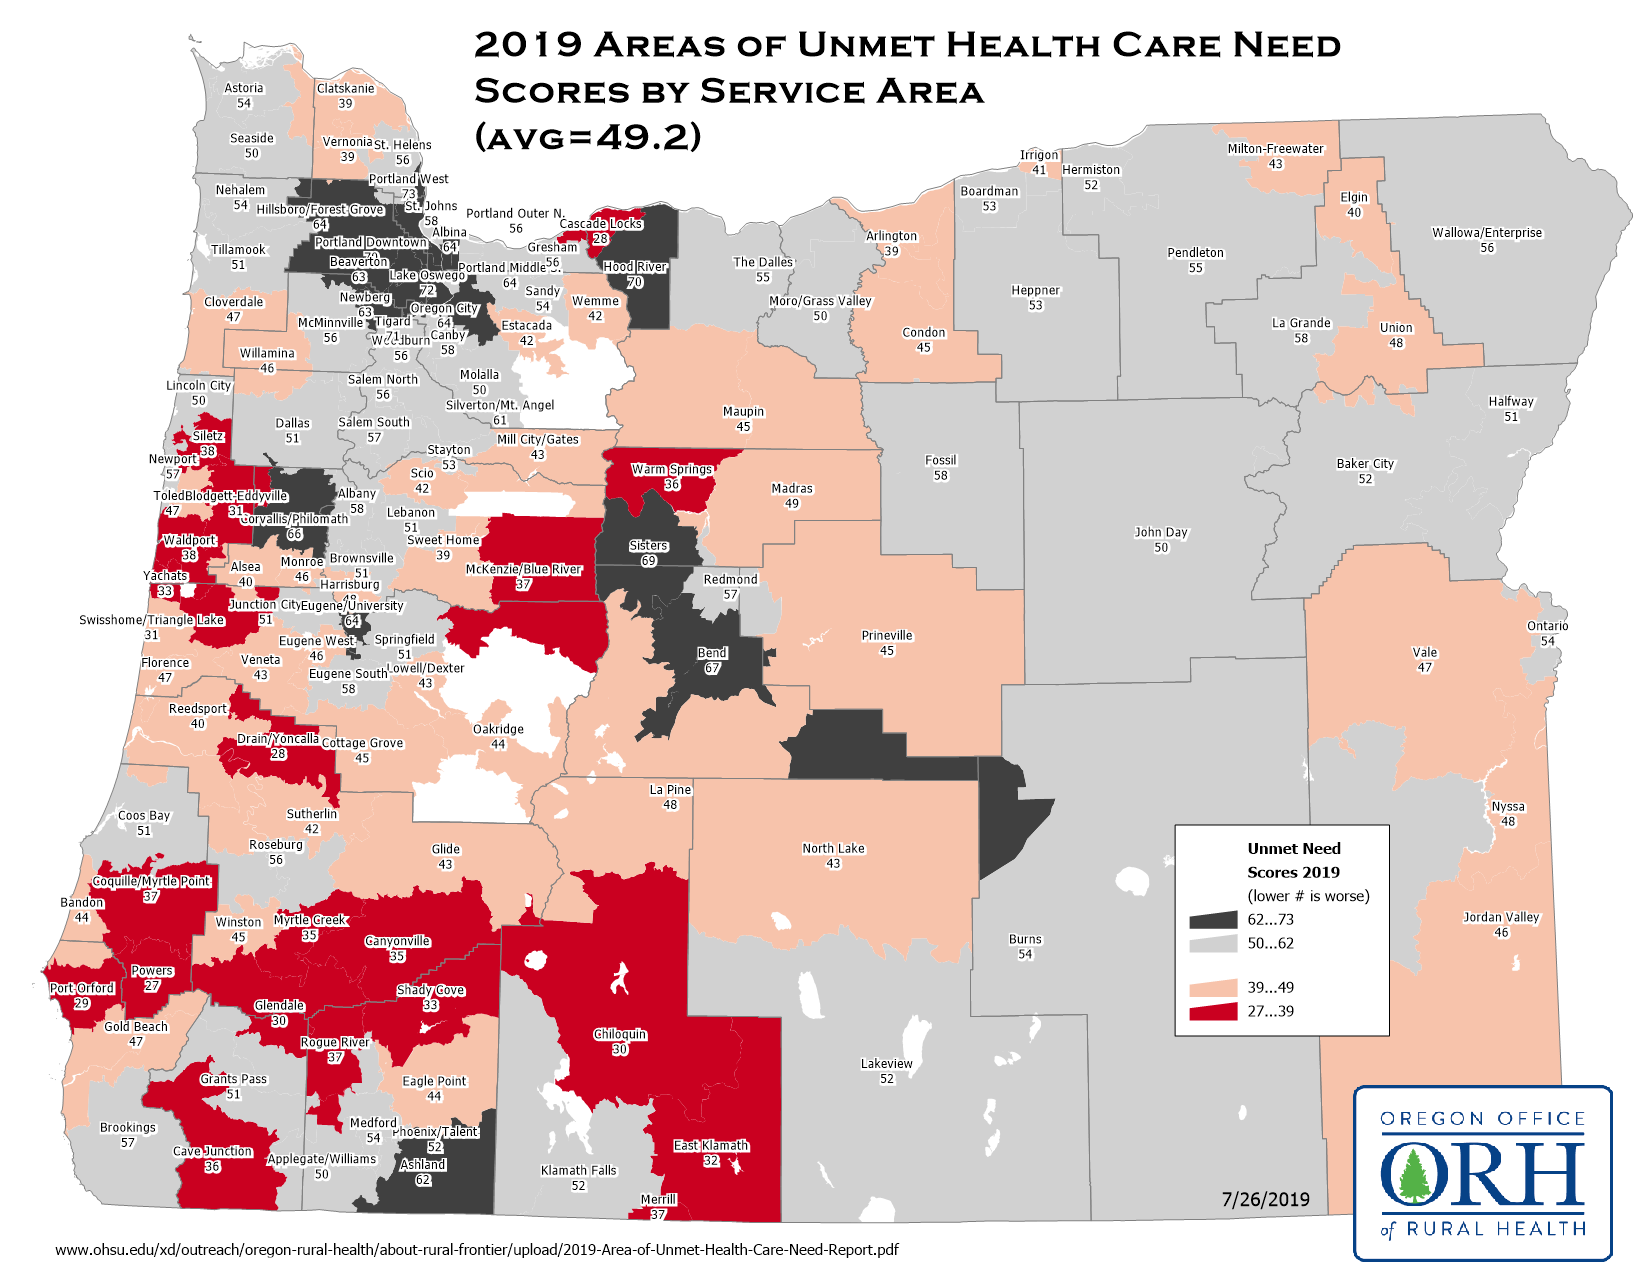
When a community has ample people to provide health care services, the level of care, access, patient satisfaction, and outcomes improve. The availability of providers is essential for an efficient and effective health care system and professional shortages can limit access to care and delay timely care.
In Central Oregon, Warm Springs had the lowest score (33), indicating the highest level of unmet needs and Sisters had the highest score (67), indicating the lowest level of unmet needs. La Pine, Madras, Prineville, and Warm Springs all had lower scores (indicating higher levels of unmet needs) compared to Oregon as a whole (mean 46.2). Bend, Sisters, and Redmond have higher scores than Oregon as a whole. The La Pine service area, which includes portions of northern Klamath County, had a score of 42.
Source: Oregon Office of Rural Health
Period of Measurement: 2019
Access to primary care providers increases the likelihood that community members will have routine checkups and screenings. Communities that lack a sufficient number of primary care providers typically have members who delay necessary care when sick and conditions can become more severe.
County: Deschutes Primary Care Provider Rate
County: Deschutes Primary Care Provider Rate
99
Providers per 100,000 population
(2021)
Compared to:


OR Counties
The distribution is based on data from 36 Oregon counties.
U.S. Counties
The distribution is based on data from 2,984 U.S. counties and county equivalents.
OR Value
(94)
The regional value is compared to the Oregon State value.
Prior Value
(100)
Prior Value compares a measured value with the previously measured value. Confidence intervals were not taken into account in determining the direction of the comparison.
Trend
This comparison measures the indicator’s values over multiple time periods.<br>The Mann-Kendall Test for Statistical Significance is used to evaluate the trend<br>over 4 to 10 periods of measure, subject to data availability and comparability.
This indicator shows the primary care provider rate per 100,000 population. Primary care providers include practicing physicians specializing in general practice medicine, family medicine, internal medicine, and pediatrics.
Period of Measurement: 2018
Oral health has been shown to impact overall health and well-being. According to the Centers for Disease Control and Prevention, nearly one-third of all adults in the United States have untreated tooth decay, or tooth caries, and one in seven adults ages 35 to 44 years old has periodontal (gum) disease. Tooth decay is the most prevalent chronic infectious disease affecting children in the U.S., and impacts more than a quarter of children ages 2 to 5 and more than half of children ages 12 to 15. Given these serious health consequences, it is important to maintain good oral health. It is recommended that adults and children see a dentist on a regular basis. Professional dental care helps to maintain the overall health of the teeth and mouth, and provides for early detection of pre-cancerous or cancerous lesions. People living in areas with low rates of dentists may have difficulty accessing the dental care they need.
County: Deschutes Dentist Rate
County: Deschutes Dentist Rate
90
Dentists per 100,000 population
(2022)
Compared to:

OR Counties
The distribution is based on data from 36 Oregon counties.
U.S. Counties
The distribution is based on data from 3,054 U.S. counties and county equivalents.
OR Value
(85)
The regional value is compared to the Oregon State value.
Prior Value
(85)
Prior Value compares a measured value with the previously measured value. Confidence intervals were not taken into account in determining the direction of the comparison.
Trend
This comparison measures the indicator’s values over multiple time periods.<br>The Mann-Kendall Test for Statistical Significance is used to evaluate the trend<br>over 4 to 10 periods of measure, subject to data availability and comparability.
This indicator shows the rate of dentists per 100,000 population.
Period of Measurement: 2020
Psychological distress can affect all aspects of our lives. It is important to recognize and address potential psychological issues before they become critical. Occasional down days are normal, but persistent mental/emotional health problems should be evaluated and treated by a qualified professional. Delays in mental health treatment can lead to increased morbidity and mortality, including the development of various psychiatric and physical comorbidities. In addition, it can lead to the adoption of life-threatening and life-altering self-treatments (e.g., licit and illicit substance abuse).
County: Deschutes Mental Health Provider Rate
County: Deschutes Mental Health Provider Rate
622
Providers per 100,000 population
(2023)
Compared to:
OR Counties
The distribution is based on data from 35 Oregon counties.
U.S. Counties
The distribution is based on data from 2,956 U.S. counties and county equivalents.
OR Value
(677)
The regional value is compared to the Oregon State value.
Prior Value
(557)
Prior Value compares a measured value with the previously measured value. Confidence intervals were not taken into account in determining the direction of the comparison.
Trend
This comparison measures the indicator’s values over multiple time periods.<br>The Mann-Kendall Test for Statistical Significance is used to evaluate the trend<br>over 4 to 10 periods of measure, subject to data availability and comparability.
This indicator shows the mental health provider rate in providers per 100,000 population.
Mental health providers include psychiatrists, psychologists, licensed clinical social workers, counselors, and advanced practice nurses specializing in mental health care.
Period of Measurement: 2021