Search for Indicators
All Data
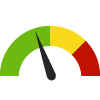
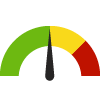
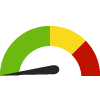
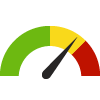
Indicator Gauge Icon Legend
Legend Colors
Red is bad, green is good, blue is not statistically different/neutral.
Compared to Distribution
 the value is in the best half of communities.
 the value is in the 2nd worst quarter of communities.
 the value is in the worst quarter of communities.
Compared to Target
 meets target;
  does not meet target.
Compared to a Single Value
 lower than the comparison value;
 higher than the comparison value;
 not statistically different from comparison value.
Trend

 non-significant change over time;
 significant change over time;
  no change over time.
Compared to Prior Value
 higher than the previous measurement period;
 lower than the previous measurement period;
 no statistically different change from previous measurement period.
State: Oregon
Health / Adolescent Health
Value
Compared to:
18.0%
Percentage
(2022)
Compared to:


Prior Value
(80.9%)
Prior Value compares a measured value with the previously measured value. Confidence intervals were not taken into account in determining the direction of the comparison.
Trend
This comparison measures the indicator’s values over multiple time periods.<br>The Mann-Kendall Test for Statistical Significance is used to evaluate the trend<br>over 4 to 10 periods of measure, subject to data availability and comparability.
24.0%
Percentage
(2022)
Compared to:
Prior Value
(88.3%)
Prior Value compares a measured value with the previously measured value. Confidence intervals were not taken into account in determining the direction of the comparison.
Trend
This comparison measures the indicator’s values over multiple time periods.<br>The Mann-Kendall Test for Statistical Significance is used to evaluate the trend<br>over 4 to 10 periods of measure, subject to data availability and comparability.
State: Oregon Positive Youth Development Benchmark: 11th Graders
State: Oregon Positive Youth Development Benchmark: 11th Graders
41.1%
(2022)
Compared to:

Prior Value
(49.4%)
Prior Value compares a measured value with the previously measured value. Confidence intervals were not taken into account in determining the direction of the comparison.
Trend
This comparison measures the indicator’s values over multiple time periods.<br>The Mann-Kendall Test for Statistical Significance is used to evaluate the trend<br>over 4 to 10 periods of measure, subject to data availability and comparability.
State: Oregon Positive Youth Development Benchmark: 8th Graders
State: Oregon Positive Youth Development Benchmark: 8th Graders
48.0%
(2022)
Compared to:
Prior Value
(49.4%)
Prior Value compares a measured value with the previously measured value. Confidence intervals were not taken into account in determining the direction of the comparison.
Trend
This comparison measures the indicator’s values over multiple time periods.<br>The Mann-Kendall Test for Statistical Significance is used to evaluate the trend<br>over 4 to 10 periods of measure, subject to data availability and comparability.
7.7%
Percent (%)
(2022)
Compared to:
Prior Value
(10.6%)
Prior Value compares a measured value with the previously measured value. Confidence intervals were not taken into account in determining the direction of the comparison.
Trend
This comparison measures the indicator’s values over multiple time periods.<br>The Mann-Kendall Test for Statistical Significance is used to evaluate the trend<br>over 4 to 10 periods of measure, subject to data availability and comparability.
14.5%
Percent (%)
(2022)
Compared to:
Prior Value
(14.1%)
Prior Value compares a measured value with the previously measured value. Confidence intervals were not taken into account in determining the direction of the comparison.
Trend
This comparison measures the indicator’s values over multiple time periods.<br>The Mann-Kendall Test for Statistical Significance is used to evaluate the trend<br>over 4 to 10 periods of measure, subject to data availability and comparability.
22.2%
(2022)
Compared to:
Prior Value
(39.7%)
Prior Value compares a measured value with the previously measured value. Confidence intervals were not taken into account in determining the direction of the comparison.
Trend
This comparison measures the indicator’s values over multiple time periods.<br>The Mann-Kendall Test for Statistical Significance is used to evaluate the trend<br>over 4 to 10 periods of measure, subject to data availability and comparability.
15.0%
(2022)
Compared to:
Prior Value
(31.3%)
Prior Value compares a measured value with the previously measured value. Confidence intervals were not taken into account in determining the direction of the comparison.
Trend
This comparison measures the indicator’s values over multiple time periods.<br>The Mann-Kendall Test for Statistical Significance is used to evaluate the trend<br>over 4 to 10 periods of measure, subject to data availability and comparability.
State: Oregon Students with No Physical Activity: 11th Graders
State: Oregon Students with No Physical Activity: 11th Graders
12.4%
(2019)
Compared to:
Prior Value
(13.4%)
Prior Value compares a measured value with the previously measured value. Confidence intervals were not taken into account in determining the direction of the comparison.
Trend
This comparison measures the indicator’s values over multiple time periods.<br>The Mann-Kendall Test for Statistical Significance is used to evaluate the trend<br>over 4 to 10 periods of measure, subject to data availability and comparability.
State: Oregon Students with No Physical Activity: 8th Graders
State: Oregon Students with No Physical Activity: 8th Graders
7.5%
(2019)
Compared to:
Prior Value
(6.4%)
Prior Value compares a measured value with the previously measured value. Confidence intervals were not taken into account in determining the direction of the comparison.
State: Oregon
Health / Alcohol & Drug Use
Value
Compared to:
State: Oregon Adults who Binge Drink (CDC 500 Cities)
State: Oregon Adults who Binge Drink (CDC 500 Cities)
17.4%
(2018)
Compared to:

Prior Value
(18.1%)
Prior Value compares a measured value with the previously measured value. Confidence intervals were taken into account in determining the direction of the comparison.
Trend
This comparison measures the indicator’s values over multiple time periods.<br>The Mann-Kendall Test for Statistical Significance is used to evaluate the trend<br>over 4 to 10 periods of measure, subject to data availability and comparability.
State: Oregon Age-Adjusted Death Rate due to Alcohol Consumption
State: Oregon Age-Adjusted Death Rate due to Alcohol Consumption
45.4
Deaths per 100,000 population
(2017-2020)
Compared to:


Prior Value
(43.4)
Prior Value compares a measured value with the previously measured value. Confidence intervals were not taken into account in determining the direction of the comparison.
Trend
This comparison measures the indicator’s values over multiple time periods.<br>The Mann-Kendall Test for Statistical Significance is used to evaluate the trend<br>over 4 to 10 periods of measure, subject to data availability and comparability.
15.1
Deaths per 100,000 population
(2018-2020)
Compared to:

U.S. States
The distribution is based on data from 50 U.S. states and the District of Columbia.
US Value
(23.5)
The regional value is compared to the national value.
Prior Value
(13.9)
Prior Value compares a measured value with the previously measured value. Confidence intervals were taken into account in determining the direction of the comparison.
State: Oregon Death due to Opioid Overdose
State: Oregon Death due to Opioid Overdose
6.8
Deaths per 100,000 population
(2013-2017)
Compared to:
Prior Value
(8.2)
Prior Value compares a measured value with the previously measured value. Confidence intervals were not taken into account in determining the direction of the comparison.
State: Oregon Death Rate due to All Drug Overdose
State: Oregon Death Rate due to All Drug Overdose
9.7
Deaths per 100,000 population
(2013-2017)
Compared to:
Prior Value
(10.4)
Prior Value compares a measured value with the previously measured value. Confidence intervals were not taken into account in determining the direction of the comparison.
State: Oregon Death Rate due to Drug Poisoning
State: Oregon Death Rate due to Drug Poisoning
20.4
Deaths per 100,000 population
(2019-2021)
Compared to:
U.S. States
The distribution is based on data from 50 U.S. states and the District of Columbia.
US Value
(27.2)
The regional value is compared to the national value.
HP 2030 Target
(20.7)
<div>SU-03: Reduce drug overdose deaths <strong>(LEADING HEALTH INDICATOR)</strong></div>
3.4
Deaths per 100,000
(2015-2017)
Compared to:
Prior Value
(2.0)
Prior Value compares a measured value with the previously measured value. Confidence intervals were not taken into account in determining the direction of the comparison.
Trend
This comparison measures the indicator’s values over multiple time periods.<br>The Mann-Kendall Test for Statistical Significance is used to evaluate the trend<br>over 4 to 10 periods of measure, subject to data availability and comparability.
State: Oregon Hospital Admission Rate due to Drug Overdose
State: Oregon Hospital Admission Rate due to Drug Overdose
97.0
Admissions per 100,000 population
(2018)
Compared to:
Prior Value
(99.7)
Prior Value compares a measured value with the previously measured value. Confidence intervals were not taken into account in determining the direction of the comparison.
Trend
This comparison measures the indicator’s values over multiple time periods.<br>The Mann-Kendall Test for Statistical Significance is used to evaluate the trend<br>over 4 to 10 periods of measure, subject to data availability and comparability.
34.2
Per 100,000 Residents
(2020 Q1)
Compared to:


Prior Value
(33.5)
Prior Value compares a measured value with the previously measured value. Confidence intervals were not taken into account in determining the direction of the comparison.
Trend
This comparison measures the indicator’s values over multiple time periods.<br>The Mann-Kendall Test for Statistical Significance is used to evaluate the trend<br>over 4 to 10 periods of measure, subject to data availability and comparability.
3.4
Per 100,000 Residents
(2020 Q1)
Compared to:

Prior Value
(3.0)
Prior Value compares a measured value with the previously measured value. Confidence intervals were not taken into account in determining the direction of the comparison.
Trend
This comparison measures the indicator’s values over multiple time periods.<br>The Mann-Kendall Test for Statistical Significance is used to evaluate the trend<br>over 4 to 10 periods of measure, subject to data availability and comparability.
State: Oregon Individuals Receiving Drug per 1,000 Residents: Opioid
State: Oregon Individuals Receiving Drug per 1,000 Residents: Opioid
70.2
Per 100,000 population
(2021, Q3)
Compared to:

Prior Value
(71.0)
Prior Value compares a measured value with the previously measured value. Confidence intervals were not taken into account in determining the direction of the comparison.
Trend
This comparison measures the indicator’s values over multiple time periods.<br>The Mann-Kendall Test for Statistical Significance is used to evaluate the trend<br>over 4 to 10 periods of measure, subject to data availability and comparability.
97.0
Per 100,000 population
(2018)
Compared to:
Prior Value
(99.6)
Prior Value compares a measured value with the previously measured value. Confidence intervals were not taken into account in determining the direction of the comparison.
Trend
This comparison measures the indicator’s values over multiple time periods.<br>The Mann-Kendall Test for Statistical Significance is used to evaluate the trend<br>over 4 to 10 periods of measure, subject to data availability and comparability.
7.29%
Percent (%)
(Q4 2019)
Compared to:
Prior Value
(8.80%)
Prior Value compares a measured value with the previously measured value. Confidence intervals were not taken into account in determining the direction of the comparison.
Trend
This comparison measures the indicator’s values over multiple time periods.<br>The Mann-Kendall Test for Statistical Significance is used to evaluate the trend<br>over 4 to 10 periods of measure, subject to data availability and comparability.
State: Oregon Quarterly Opioid Prescription Rate
State: Oregon Quarterly Opioid Prescription Rate
1,427.0
Prescriptions per 1,000 population
(2023, Q2)
Compared to:
Prior Value
(1,413.0)
Prior Value compares a measured value with the previously measured value. Confidence intervals were not taken into account in determining the direction of the comparison.
Trend
This comparison measures the indicator’s values over multiple time periods.<br>The Mann-Kendall Test for Statistical Significance is used to evaluate the trend<br>over 4 to 10 periods of measure, subject to data availability and comparability.
State: Oregon Students who Binge Drink: 11th Graders
State: Oregon Students who Binge Drink: 11th Graders
7.0%
(2022)
Compared to:
Prior Value
(7.3%)
Prior Value compares a measured value with the previously measured value. Confidence intervals were not taken into account in determining the direction of the comparison.
Trend
This comparison measures the indicator’s values over multiple time periods.<br>The Mann-Kendall Test for Statistical Significance is used to evaluate the trend<br>over 4 to 10 periods of measure, subject to data availability and comparability.
State: Oregon Students who Binge Drink: 8th Graders
State: Oregon Students who Binge Drink: 8th Graders
2.0%
(2022)
Compared to:
Prior Value
(2.3%)
Prior Value compares a measured value with the previously measured value. Confidence intervals were not taken into account in determining the direction of the comparison.
Trend
This comparison measures the indicator’s values over multiple time periods.<br>The Mann-Kendall Test for Statistical Significance is used to evaluate the trend<br>over 4 to 10 periods of measure, subject to data availability and comparability.
State: Oregon Students who Use Alcohol: 11th Graders
State: Oregon Students who Use Alcohol: 11th Graders
16.6%
(2022)
Compared to:
Prior Value
(17.0%)
Prior Value compares a measured value with the previously measured value. Confidence intervals were not taken into account in determining the direction of the comparison.
Trend
This comparison measures the indicator’s values over multiple time periods.<br>The Mann-Kendall Test for Statistical Significance is used to evaluate the trend<br>over 4 to 10 periods of measure, subject to data availability and comparability.
State: Oregon Students who Use Alcohol: 8th Graders
State: Oregon Students who Use Alcohol: 8th Graders
5.9%
(2022)
Compared to:
Prior Value
(6.1%)
Prior Value compares a measured value with the previously measured value. Confidence intervals were not taken into account in determining the direction of the comparison.
Trend
This comparison measures the indicator’s values over multiple time periods.<br>The Mann-Kendall Test for Statistical Significance is used to evaluate the trend<br>over 4 to 10 periods of measure, subject to data availability and comparability.
State: Oregon
Health / Cancer
Value
Compared to:
State: Oregon Adults with Cancer: Age-adjusted
State: Oregon Adults with Cancer: Age-adjusted
7.2%
(2014-2017)
Compared to:
Prior Value
(7.9%)
Prior Value compares a measured value with the previously measured value. Confidence intervals were not taken into account in determining the direction of the comparison.
State: Oregon Age-Adjusted Death Rate due to Breast Cancer
State: Oregon Age-Adjusted Death Rate due to Breast Cancer
19.3
Deaths per 100,000 females
(2016-2020)
Compared to:
U.S. States
The distribution is based on data from 50 U.S. states and the District of Columbia.
US Value
(19.6)
The regional value is compared to the national value.
Prior Value
(19.6)
Prior Value compares a measured value with the previously measured value. Confidence intervals were taken into account in determining the direction of the comparison.
Trend
This comparison measures the indicator’s values over multiple time periods.<br>The Mann-Kendall Test for Statistical Significance is used to evaluate the trend<br>over 4 to 10 periods of measure, subject to data availability and comparability.
HP 2030 Target
(15.3)
State: Oregon Age-Adjusted Death Rate due to Cancer
State: Oregon Age-Adjusted Death Rate due to Cancer
150.6
Deaths per 100,000 population
(2016-2020)
Compared to:

U.S. States
The distribution is based on data from 50 U.S. states and the District of Columbia.
US Value
(149.4)
The regional value is compared to the national value.
Prior Value
(153.7)
Prior Value compares a measured value with the previously measured value. Confidence intervals were taken into account in determining the direction of the comparison.
Trend
This comparison measures the indicator’s values over multiple time periods.<br>The Mann-Kendall Test for Statistical Significance is used to evaluate the trend<br>over 4 to 10 periods of measure, subject to data availability and comparability.
HP 2030 Target
(122.7)
State: Oregon Age-Adjusted Death Rate due to Colorectal Cancer
State: Oregon Age-Adjusted Death Rate due to Colorectal Cancer
12.3
Deaths per 100,000 population
(2016-2020)
Compared to:
U.S. States
The distribution is based on data from 50 U.S. states and the District of Columbia.
US Value
(13.1)
The regional value is compared to the national value.
Prior Value
(12.6)
Prior Value compares a measured value with the previously measured value. Confidence intervals were taken into account in determining the direction of the comparison.
Trend
This comparison measures the indicator’s values over multiple time periods.<br>The Mann-Kendall Test for Statistical Significance is used to evaluate the trend<br>over 4 to 10 periods of measure, subject to data availability and comparability.
HP 2030 Target
(8.9)
State: Oregon Age-Adjusted Death Rate due to Lung Cancer
State: Oregon Age-Adjusted Death Rate due to Lung Cancer
33.2
Deaths per 100,000 population
(2016-2020)
Compared to:
U.S. States
The distribution is based on data from 50 U.S. states and the District of Columbia.
US Value
(35.0)
The regional value is compared to the national value.
Prior Value
(34.8)
Prior Value compares a measured value with the previously measured value. Confidence intervals were taken into account in determining the direction of the comparison.
Trend
This comparison measures the indicator’s values over multiple time periods.<br>The Mann-Kendall Test for Statistical Significance is used to evaluate the trend<br>over 4 to 10 periods of measure, subject to data availability and comparability.
HP 2030 Target
(25.1)
State: Oregon Age-Adjusted Death Rate due to Prostate Cancer
State: Oregon Age-Adjusted Death Rate due to Prostate Cancer
20.3
Deaths per 100,000 males
(2016-2020)
Compared to:

U.S. States
The distribution is based on data from 50 U.S. states and the District of Columbia.
US Value
(18.8)
The regional value is compared to the national value.
Prior Value
(20.7)
Prior Value compares a measured value with the previously measured value. Confidence intervals were taken into account in determining the direction of the comparison.
Trend
This comparison measures the indicator’s values over multiple time periods.<br>The Mann-Kendall Test for Statistical Significance is used to evaluate the trend<br>over 4 to 10 periods of measure, subject to data availability and comparability.
HP 2030 Target
(16.9)
State: Oregon All Cancer Incidence Rate
State: Oregon All Cancer Incidence Rate
419.2
Cases per 100,000 population
(2016-2020)
Compared to:
U.S. States
The distribution is based on data from 48 U.S. states and the District of Columbia.
US Value
(442.3)
The regional value is compared to the national value.
Prior Value
(428.4)
Prior Value compares a measured value with the previously measured value. Confidence intervals were taken into account in determining the direction of the comparison.
Trend
This comparison measures the indicator’s values over multiple time periods.<br>The Mann-Kendall Test for Statistical Significance is used to evaluate the trend<br>over 4 to 10 periods of measure, subject to data availability and comparability.
State: Oregon Breast Cancer Incidence Rate
State: Oregon Breast Cancer Incidence Rate
128.8
Cases per 100,000 females
(2016-2020)
Compared to:
U.S. States
The distribution is based on data from 48 U.S. states and the District of Columbia.
US Value
(127.0)
The regional value is compared to the national value.
Prior Value
(130.6)
Prior Value compares a measured value with the previously measured value. Confidence intervals were taken into account in determining the direction of the comparison.
Trend
This comparison measures the indicator’s values over multiple time periods.<br>The Mann-Kendall Test for Statistical Significance is used to evaluate the trend<br>over 4 to 10 periods of measure, subject to data availability and comparability.
State: Oregon Cancer: Medicare Population
State: Oregon Cancer: Medicare Population
10.0%
(2022)
Compared to:

U.S. States
The distribution is based on data from 50 U.S. states and the District of Columbia.
US Value
(12.0%)
The regional value is compared to the national value.
Prior Value
(10.0%)
Prior Value compares a measured value with the previously measured value. Confidence intervals were not taken into account in determining the direction of the comparison.
Trend
This comparison measures the indicator’s values over multiple time periods.<br>The Mann-Kendall Test for Statistical Significance is used to evaluate the trend<br>over 4 to 10 periods of measure, subject to data availability and comparability.
State: Oregon Cervical Cancer Incidence Rate
State: Oregon Cervical Cancer Incidence Rate
6.6
Cases per 100,000 females
(2016-2020)
Compared to:
U.S. States
The distribution is based on data from 48 U.S. states and the District of Columbia.
US Value
(7.5)
The regional value is compared to the national value.
Prior Value
(6.8)
Prior Value compares a measured value with the previously measured value. Confidence intervals were taken into account in determining the direction of the comparison.
Trend
This comparison measures the indicator’s values over multiple time periods.<br>The Mann-Kendall Test for Statistical Significance is used to evaluate the trend<br>over 4 to 10 periods of measure, subject to data availability and comparability.
State: Oregon Colorectal Cancer Incidence Rate
State: Oregon Colorectal Cancer Incidence Rate
32.8
Cases per 100,000 population
(2016-2020)
Compared to:
U.S. States
The distribution is based on data from 48 U.S. states and the District of Columbia.
US Value
(36.5)
The regional value is compared to the national value.
Prior Value
(33.7)
Prior Value compares a measured value with the previously measured value. Confidence intervals were taken into account in determining the direction of the comparison.
Trend
This comparison measures the indicator’s values over multiple time periods.<br>The Mann-Kendall Test for Statistical Significance is used to evaluate the trend<br>over 4 to 10 periods of measure, subject to data availability and comparability.
State: Oregon Lung and Bronchus Cancer Incidence Rate
State: Oregon Lung and Bronchus Cancer Incidence Rate
49.1
Cases per 100,000 population
(2016-2020)
Compared to:
U.S. States
The distribution is based on data from 48 U.S. states and the District of Columbia.
US Value
(54.0)
The regional value is compared to the national value.
Prior Value
(51.3)
Prior Value compares a measured value with the previously measured value. Confidence intervals were taken into account in determining the direction of the comparison.
Trend
This comparison measures the indicator’s values over multiple time periods.<br>The Mann-Kendall Test for Statistical Significance is used to evaluate the trend<br>over 4 to 10 periods of measure, subject to data availability and comparability.
State: Oregon Mammography Screening: Medicare Population
State: Oregon Mammography Screening: Medicare Population
45.0%
(2022)
Compared to:

U.S. States
The distribution is based on data from 50 U.S. states and the District of Columbia.
US Value
(47.0%)
The regional value is compared to the national value.
Prior Value
(44.0%)
Prior Value compares a measured value with the previously measured value. Confidence intervals were not taken into account in determining the direction of the comparison.
Trend
This comparison measures the indicator’s values over multiple time periods.<br>The Mann-Kendall Test for Statistical Significance is used to evaluate the trend<br>over 4 to 10 periods of measure, subject to data availability and comparability.
State: Oregon Oral Cavity and Pharynx Cancer Incidence Rate
State: Oregon Oral Cavity and Pharynx Cancer Incidence Rate
12.2
Cases per 100,000 population
(2016-2020)
Compared to:
U.S. States
The distribution is based on data from 48 U.S. states and the District of Columbia.
US Value
(11.9)
The regional value is compared to the national value.
Prior Value
(12.4)
Prior Value compares a measured value with the previously measured value. Confidence intervals were taken into account in determining the direction of the comparison.
Trend
This comparison measures the indicator’s values over multiple time periods.<br>The Mann-Kendall Test for Statistical Significance is used to evaluate the trend<br>over 4 to 10 periods of measure, subject to data availability and comparability.
State: Oregon Pap Test in Past 3 Years: 21-65
State: Oregon Pap Test in Past 3 Years: 21-65
80.3%
(2014-2017)
Compared to:
Prior Value
(81.5%)
Prior Value compares a measured value with the previously measured value. Confidence intervals were not taken into account in determining the direction of the comparison.
Trend
This comparison measures the indicator’s values over multiple time periods.<br>The Mann-Kendall Test for Statistical Significance is used to evaluate the trend<br>over 4 to 10 periods of measure, subject to data availability and comparability.
State: Oregon Prostate Cancer Incidence Rate
State: Oregon Prostate Cancer Incidence Rate
94.4
Cases per 100,000 males
(2016-2020)
Compared to:
U.S. States
The distribution is based on data from 48 U.S. states and the District of Columbia.
US Value
(110.5)
The regional value is compared to the national value.
Prior Value
(96.4)
Prior Value compares a measured value with the previously measured value. Confidence intervals were taken into account in determining the direction of the comparison.
Trend
This comparison measures the indicator’s values over multiple time periods.<br>The Mann-Kendall Test for Statistical Significance is used to evaluate the trend<br>over 4 to 10 periods of measure, subject to data availability and comparability.
State: Oregon
Health / Diabetes
Value
Compared to:
State: Oregon Age-Adjusted Death Rate due to Diabetes
State: Oregon Age-Adjusted Death Rate due to Diabetes
23.5
Deaths per 100,000 population
(2015-2017)
Compared to:
US Value
(21.2)
The regional value is compared to the national value. The source for the national value is Centers for Disease Control and Prevention
Prior Value
(23.0)
Prior Value compares a measured value with the previously measured value. Confidence intervals were not taken into account in determining the direction of the comparison.
Trend
This comparison measures the indicator’s values over multiple time periods.<br>The Mann-Kendall Test for Statistical Significance is used to evaluate the trend<br>over 4 to 10 periods of measure, subject to data availability and comparability.
State: Oregon Diabetes: Medicare Population
State: Oregon Diabetes: Medicare Population
19.0%
(2022)
Compared to:
U.S. States
The distribution is based on data from 50 U.S. states and the District of Columbia.
US Value
(24.0%)
The regional value is compared to the national value.
Prior Value
(19.0%)
Prior Value compares a measured value with the previously measured value. Confidence intervals were not taken into account in determining the direction of the comparison.
Trend
This comparison measures the indicator’s values over multiple time periods.<br>The Mann-Kendall Test for Statistical Significance is used to evaluate the trend<br>over 4 to 10 periods of measure, subject to data availability and comparability.
State: Oregon
Health / Disabilities
Value
Compared to:
State: Oregon Adults with Disability
State: Oregon Adults with Disability
13.0%
(2022)
Compared to:

Prior Value
(12.9%)
Prior Value compares a measured value with the previously measured value. Confidence intervals were taken into account in determining the direction of the comparison.
Trend
This comparison measures the indicator’s values over multiple time periods.<br>The Mann-Kendall Test for Statistical Significance is used to evaluate the trend<br>over 4 to 10 periods of measure, subject to data availability and comparability.
State: Oregon Adults with Disability Living in Poverty
State: Oregon Adults with Disability Living in Poverty
27.2%
(2018-2022)
Compared to:
U.S. States
The distribution is based on data from 50 U.S. states and the District of Columbia.
US Value
(24.9%)
The regional value is compared to the national value.
Trend
This comparison measures the indicator’s values over multiple time periods.<br>The Mann-Kendall Test for Statistical Significance is used to evaluate the trend<br>over 4 to 10 periods of measure, subject to data availability and comparability.
State: Oregon Children with a Disability
State: Oregon Children with a Disability
5.4%
(2022)
Compared to:
Prior Value
(5.1%)
Prior Value compares a measured value with the previously measured value. Confidence intervals were taken into account in determining the direction of the comparison.
Trend
This comparison measures the indicator’s values over multiple time periods.<br>The Mann-Kendall Test for Statistical Significance is used to evaluate the trend<br>over 4 to 10 periods of measure, subject to data availability and comparability.
State: Oregon Persons with a Cognitive Difficulty
State: Oregon Persons with a Cognitive Difficulty
6.7%
(2018-2022)
Compared to:

US Value
(5.3%)
The regional value is compared to the national value.
Trend
This comparison measures the indicator’s values over multiple time periods.<br>The Mann-Kendall Test for Statistical Significance is used to evaluate the trend<br>over 4 to 10 periods of measure, subject to data availability and comparability.
State: Oregon Persons with a Disability
State: Oregon Persons with a Disability
15.6%
(2022)
Compared to:
Prior Value
(15.0%)
Prior Value compares a measured value with the previously measured value. Confidence intervals were not taken into account in determining the direction of the comparison.
Trend
This comparison measures the indicator’s values over multiple time periods.<br>The Mann-Kendall Test for Statistical Significance is used to evaluate the trend<br>over 4 to 10 periods of measure, subject to data availability and comparability.
State: Oregon Persons with a Disability
State: Oregon Persons with a Disability
14.9%
(2018-2022)
Compared to:
US Value
(12.9%)
The regional value is compared to the national value.
Trend
This comparison measures the indicator’s values over multiple time periods.<br>The Mann-Kendall Test for Statistical Significance is used to evaluate the trend<br>over 4 to 10 periods of measure, subject to data availability and comparability.
State: Oregon Persons with a Hearing Difficulty
State: Oregon Persons with a Hearing Difficulty
4.6%
(2018-2022)
Compared to:
US Value
(3.6%)
The regional value is compared to the national value.
Trend
This comparison measures the indicator’s values over multiple time periods.<br>The Mann-Kendall Test for Statistical Significance is used to evaluate the trend<br>over 4 to 10 periods of measure, subject to data availability and comparability.
State: Oregon Persons with a Self-Care Difficulty
State: Oregon Persons with a Self-Care Difficulty
2.8%
(2018-2022)
Compared to:

US Value
(2.6%)
The regional value is compared to the national value.
Trend
This comparison measures the indicator’s values over multiple time periods.<br>The Mann-Kendall Test for Statistical Significance is used to evaluate the trend<br>over 4 to 10 periods of measure, subject to data availability and comparability.
State: Oregon Persons with a Vision Difficulty
State: Oregon Persons with a Vision Difficulty
2.4%
(2018-2022)
Compared to:
US Value
(2.4%)
The regional value is compared to the national value.
Trend
This comparison measures the indicator’s values over multiple time periods.<br>The Mann-Kendall Test for Statistical Significance is used to evaluate the trend<br>over 4 to 10 periods of measure, subject to data availability and comparability.
State: Oregon Persons with an Ambulatory Difficulty
State: Oregon Persons with an Ambulatory Difficulty
7.1%
(2018-2022)
Compared to:
US Value
(6.7%)
The regional value is compared to the national value.
Trend
This comparison measures the indicator’s values over multiple time periods.<br>The Mann-Kendall Test for Statistical Significance is used to evaluate the trend<br>over 4 to 10 periods of measure, subject to data availability and comparability.
State: Oregon
Health / Family Planning
Value
Compared to:
State: Oregon Teen Pregnancy Rate: 15-17-year-old
State: Oregon Teen Pregnancy Rate: 15-17-year-old
5.8
Pregnancies per 1,000 females aged 15-17
(2021)
Compared to:
Prior Value
(5.8)
Prior Value compares a measured value with the previously measured value. Confidence intervals were not taken into account in determining the direction of the comparison.
Trend
This comparison measures the indicator’s values over multiple time periods.<br>The Mann-Kendall Test for Statistical Significance is used to evaluate the trend<br>over 4 to 10 periods of measure, subject to data availability and comparability.
State: Oregon
Health / Food Safety
Value
Compared to:
State: Oregon Campylobacteriosis Cases
State: Oregon Campylobacteriosis Cases
1,090
Cases
(2021)
Compared to:
Prior Value
(832)
Prior Value compares a measured value with the previously measured value. Confidence intervals were not taken into account in determining the direction of the comparison.
Trend
This comparison measures the indicator’s values over multiple time periods.<br>The Mann-Kendall Test for Statistical Significance is used to evaluate the trend<br>over 4 to 10 periods of measure, subject to data availability and comparability.
State: Oregon E. Coli (STEC) Cases
State: Oregon E. Coli (STEC) Cases
293
Cases
(2021)
Compared to:
Prior Value
(204)
Prior Value compares a measured value with the previously measured value. Confidence intervals were not taken into account in determining the direction of the comparison.
Trend
This comparison measures the indicator’s values over multiple time periods.<br>The Mann-Kendall Test for Statistical Significance is used to evaluate the trend<br>over 4 to 10 periods of measure, subject to data availability and comparability.
State: Oregon Vibriosis Cases
State: Oregon Vibriosis Cases
33
Cases
(2020)
Compared to:
Prior Value
(37)
Prior Value compares a measured value with the previously measured value. Confidence intervals were not taken into account in determining the direction of the comparison.
Trend
This comparison measures the indicator’s values over multiple time periods.<br>The Mann-Kendall Test for Statistical Significance is used to evaluate the trend<br>over 4 to 10 periods of measure, subject to data availability and comparability.
State: Oregon
Health / Health Care Access & Quality
Value
Compared to:
State: Oregon Adults with Health Insurance: 18-64
State: Oregon Adults with Health Insurance: 18-64
91.3%
(2021)
Compared to:
U.S. States
The distribution is based on data from 50 U.S. states and the District of Columbia.
Prior Value
(90.5%)
Prior Value compares a measured value with the previously measured value. Confidence intervals were taken into account in determining the direction of the comparison.
Trend
This comparison measures the indicator’s values over multiple time periods.<br>The Mann-Kendall Test for Statistical Significance is used to evaluate the trend<br>over 4 to 10 periods of measure, subject to data availability and comparability.
State: Oregon Children with Health Insurance
State: Oregon Children with Health Insurance
96.4%
(2021)
Compared to:
U.S. States
The distribution is based on data from 50 U.S. states and the District of Columbia.
Prior Value
(96.5%)
Prior Value compares a measured value with the previously measured value. Confidence intervals were taken into account in determining the direction of the comparison.
Trend
This comparison measures the indicator’s values over multiple time periods.<br>The Mann-Kendall Test for Statistical Significance is used to evaluate the trend<br>over 4 to 10 periods of measure, subject to data availability and comparability.
0.7
Per 100,000 runs
(2020 Q1)
Compared to:
Prior Value
(0.7)
Prior Value compares a measured value with the previously measured value. Confidence intervals were not taken into account in determining the direction of the comparison.
Trend
This comparison measures the indicator’s values over multiple time periods.<br>The Mann-Kendall Test for Statistical Significance is used to evaluate the trend<br>over 4 to 10 periods of measure, subject to data availability and comparability.
State: Oregon Medicare Healthcare Costs
State: Oregon Medicare Healthcare Costs
$7,621
Dollars per enrollee
(2015)
Compared to:

US Value
($9,729)
The regional value is compared to the national value.
Prior Value
($7,316)
Prior Value compares a measured value with the previously measured value. Confidence intervals were not taken into account in determining the direction of the comparison.
Trend
This comparison measures the indicator’s values over multiple time periods.<br>The Mann-Kendall Test for Statistical Significance is used to evaluate the trend<br>over 4 to 10 periods of measure, subject to data availability and comparability.
State: Oregon Non-Physician Primary Care Provider Rate
State: Oregon Non-Physician Primary Care Provider Rate
109
Providers per 100,000 population
(2023)
Compared to:

U.S. States
The distribution is based on data from 50 U.S. states and the District of Columbia.
Prior Value
(104)
Prior Value compares a measured value with the previously measured value. Confidence intervals were not taken into account in determining the direction of the comparison.
Trend
This comparison measures the indicator’s values over multiple time periods.<br>The Mann-Kendall Test for Statistical Significance is used to evaluate the trend<br>over 4 to 10 periods of measure, subject to data availability and comparability.
State: Oregon Persons with Health Insurance
State: Oregon Persons with Health Insurance
92.6%
(2021)
Compared to:
U.S. States
The distribution is based on data from 50 U.S. states and the District of Columbia.
Prior Value
(92.0%)
Prior Value compares a measured value with the previously measured value. Confidence intervals were taken into account in determining the direction of the comparison.
Trend
This comparison measures the indicator’s values over multiple time periods.<br>The Mann-Kendall Test for Statistical Significance is used to evaluate the trend<br>over 4 to 10 periods of measure, subject to data availability and comparability.
HP 2030 Target
(92.4%)
<div>AHS-01: Increase the proportion of people with health insurance <strong>(LEADING HEALTH INDICATOR)</strong></div>
State: Oregon Persons with Private Health Insurance Only
State: Oregon Persons with Private Health Insurance Only
52.8%
(2022)
Compared to:
US Value
(54.8%)
The regional value is compared to the national value.
Prior Value
(52.6%)
Prior Value compares a measured value with the previously measured value. Confidence intervals were not taken into account in determining the direction of the comparison.
Trend
This comparison measures the indicator’s values over multiple time periods.<br>The Mann-Kendall Test for Statistical Significance is used to evaluate the trend<br>over 4 to 10 periods of measure, subject to data availability and comparability.
State: Oregon Persons with Public Health Insurance Only
State: Oregon Persons with Public Health Insurance Only
26.9%
(2022)
Compared to:
US Value
(24.8%)
The regional value is compared to the national value.
Prior Value
(26.9%)
Prior Value compares a measured value with the previously measured value. Confidence intervals were not taken into account in determining the direction of the comparison.
Trend
This comparison measures the indicator’s values over multiple time periods.<br>The Mann-Kendall Test for Statistical Significance is used to evaluate the trend<br>over 4 to 10 periods of measure, subject to data availability and comparability.
State: Oregon Preventable Hospital Stays: Medicare Population
State: Oregon Preventable Hospital Stays: Medicare Population
1,812.0
Discharges per 100,000 Medicare enrollees
(2022)
Compared to:
U.S. States
The distribution is based on data from 50 U.S. states and the District of Columbia.
US Value
(2,677.0)
The regional value is compared to the national value.
Prior Value
(1,799.0)
Prior Value compares a measured value with the previously measured value. Confidence intervals were not taken into account in determining the direction of the comparison.
Trend
This comparison measures the indicator’s values over multiple time periods.<br>The Mann-Kendall Test for Statistical Significance is used to evaluate the trend<br>over 4 to 10 periods of measure, subject to data availability and comparability.
State: Oregon Primary Care Provider Rate
State: Oregon Primary Care Provider Rate
94
Providers per 100,000 population
(2021)
Compared to:
U.S. States
The distribution is based on data from 50 U.S. states and the District of Columbia.
Prior Value
(94)
Prior Value compares a measured value with the previously measured value. Confidence intervals were not taken into account in determining the direction of the comparison.
Trend
This comparison measures the indicator’s values over multiple time periods.<br>The Mann-Kendall Test for Statistical Significance is used to evaluate the trend<br>over 4 to 10 periods of measure, subject to data availability and comparability.
State: Oregon
Health / Health Information Technology
Value
Compared to:
State: Oregon Households with an Internet Subscription
State: Oregon Households with an Internet Subscription
90.8%
(2018-2022)
Compared to:
U.S. States
The distribution is based on data from 50 U.S. states and the District of Columbia.
US Value
(88.5%)
The regional value is compared to the national value.
Trend
This comparison measures the indicator’s values over multiple time periods.<br>The Mann-Kendall Test for Statistical Significance is used to evaluate the trend<br>over 4 to 10 periods of measure, subject to data availability and comparability.
State: Oregon Households with One or More Types of Computing Devices
State: Oregon Households with One or More Types of Computing Devices
95.7%
(2018-2022)
Compared to:
U.S. States
The distribution is based on data from 50 U.S. states and the District of Columbia.
US Value
(94.0%)
The regional value is compared to the national value.
Trend
This comparison measures the indicator’s values over multiple time periods.<br>The Mann-Kendall Test for Statistical Significance is used to evaluate the trend<br>over 4 to 10 periods of measure, subject to data availability and comparability.
State: Oregon Persons with an Internet Subscription
State: Oregon Persons with an Internet Subscription
93.0%
(2018-2022)
Compared to:
U.S. States
The distribution is based on data from 50 U.S. states and the District of Columbia.
US Value
(91.0%)
The regional value is compared to the national value.
Trend
This comparison measures the indicator’s values over multiple time periods.<br>The Mann-Kendall Test for Statistical Significance is used to evaluate the trend<br>over 4 to 10 periods of measure, subject to data availability and comparability.
State: Oregon
Health / Heart Disease & Stroke
Value
Compared to:
State: Oregon Adults with Cardiovascular Disease
State: Oregon Adults with Cardiovascular Disease
7.1%
(2014-2017)
Compared to:
Prior Value
(7.1%)
Prior Value compares a measured value with the previously measured value. Confidence intervals were not taken into account in determining the direction of the comparison.
37.9
Deaths per 100,000 population
(2015-2017)
Compared to:
US Value
(37.5)
The regional value is compared to the national value. The source for the national value is Centers for Disease Control and Prevention
Prior Value
(37.2)
Prior Value compares a measured value with the previously measured value. Confidence intervals were not taken into account in determining the direction of the comparison.
Trend
This comparison measures the indicator’s values over multiple time periods.<br>The Mann-Kendall Test for Statistical Significance is used to evaluate the trend<br>over 4 to 10 periods of measure, subject to data availability and comparability.
HP 2030 Target
(33.4)
State: Oregon Age-Adjusted Death Rate due to Heart Attack
State: Oregon Age-Adjusted Death Rate due to Heart Attack
35.5
Deaths per 100,000 population 35+ years
(2020)
Compared to:
Prior Value
(35.7)
Prior Value compares a measured value with the previously measured value. Confidence intervals were not taken into account in determining the direction of the comparison.
Trend
This comparison measures the indicator’s values over multiple time periods.<br>The Mann-Kendall Test for Statistical Significance is used to evaluate the trend<br>over 4 to 10 periods of measure, subject to data availability and comparability.
State: Oregon Age-Adjusted Death Rate due to Heart Disease
State: Oregon Age-Adjusted Death Rate due to Heart Disease
133.6
Deaths per 100,000 population
(2015-2017)
Compared to:
US Value
(94.8)
The regional value is compared to the national value. The source for the national value is Centers for Disease Control and Prevention
Prior Value
(133.6)
Prior Value compares a measured value with the previously measured value. Confidence intervals were not taken into account in determining the direction of the comparison.
Trend
This comparison measures the indicator’s values over multiple time periods.<br>The Mann-Kendall Test for Statistical Significance is used to evaluate the trend<br>over 4 to 10 periods of measure, subject to data availability and comparability.
State: Oregon Age-Adjusted Hospitalization Rate due to Heart Attack
State: Oregon Age-Adjusted Hospitalization Rate due to Heart Attack
20.9
Hospitalizations per 10,000 population 35+ years
(2020)
Compared to:
Prior Value
(25.7)
Prior Value compares a measured value with the previously measured value. Confidence intervals were not taken into account in determining the direction of the comparison.
Trend
This comparison measures the indicator’s values over multiple time periods.<br>The Mann-Kendall Test for Statistical Significance is used to evaluate the trend<br>over 4 to 10 periods of measure, subject to data availability and comparability.
State: Oregon Atrial Fibrillation: Medicare Population
State: Oregon Atrial Fibrillation: Medicare Population
13.0%
(2022)
Compared to:
U.S. States
The distribution is based on data from 50 U.S. states and the District of Columbia.
US Value
(14.0%)
The regional value is compared to the national value.
Prior Value
(13.0%)
Prior Value compares a measured value with the previously measured value. Confidence intervals were not taken into account in determining the direction of the comparison.
Trend
This comparison measures the indicator’s values over multiple time periods.<br>The Mann-Kendall Test for Statistical Significance is used to evaluate the trend<br>over 4 to 10 periods of measure, subject to data availability and comparability.
State: Oregon Heart Failure: Medicare Population
State: Oregon Heart Failure: Medicare Population
10.0%
(2022)
Compared to:
U.S. States
The distribution is based on data from 50 U.S. states and the District of Columbia.
US Value
(11.0%)
The regional value is compared to the national value.
Prior Value
(10.0%)
Prior Value compares a measured value with the previously measured value. Confidence intervals were not taken into account in determining the direction of the comparison.
Trend
This comparison measures the indicator’s values over multiple time periods.<br>The Mann-Kendall Test for Statistical Significance is used to evaluate the trend<br>over 4 to 10 periods of measure, subject to data availability and comparability.
State: Oregon High Cholesterol Prevalence
State: Oregon High Cholesterol Prevalence
28.3%
(2014-2017)
Compared to:
US Value
(35.7% in 2021)
The regional value is compared to the national value. The source for the national value is Behavioral Risk Factor Surveillance System
Prior Value
(31.3%)
Prior Value compares a measured value with the previously measured value. Confidence intervals were not taken into account in determining the direction of the comparison.
Trend
This comparison measures the indicator’s values over multiple time periods.<br>The Mann-Kendall Test for Statistical Significance is used to evaluate the trend<br>over 4 to 10 periods of measure, subject to data availability and comparability.
State: Oregon Hyperlipidemia: Medicare Population
State: Oregon Hyperlipidemia: Medicare Population
53.0%
(2022)
Compared to:
U.S. States
The distribution is based on data from 50 U.S. states and the District of Columbia.
US Value
(65.0%)
The regional value is compared to the national value.
Prior Value
(52.0%)
Prior Value compares a measured value with the previously measured value. Confidence intervals were not taken into account in determining the direction of the comparison.
Trend
This comparison measures the indicator’s values over multiple time periods.<br>The Mann-Kendall Test for Statistical Significance is used to evaluate the trend<br>over 4 to 10 periods of measure, subject to data availability and comparability.
State: Oregon Hypertension: Medicare Population
State: Oregon Hypertension: Medicare Population
56.0%
(2022)
Compared to:
U.S. States
The distribution is based on data from 50 U.S. states and the District of Columbia.
US Value
(65.0%)
The regional value is compared to the national value.
Prior Value
(55.0%)
Prior Value compares a measured value with the previously measured value. Confidence intervals were not taken into account in determining the direction of the comparison.
Trend
This comparison measures the indicator’s values over multiple time periods.<br>The Mann-Kendall Test for Statistical Significance is used to evaluate the trend<br>over 4 to 10 periods of measure, subject to data availability and comparability.
State: Oregon Ischemic Heart Disease: Medicare Population
State: Oregon Ischemic Heart Disease: Medicare Population
15.0%
(2022)
Compared to:
U.S. States
The distribution is based on data from 50 U.S. states and the District of Columbia.
US Value
(21.0%)
The regional value is compared to the national value.
Prior Value
(15.0%)
Prior Value compares a measured value with the previously measured value. Confidence intervals were not taken into account in determining the direction of the comparison.
Trend
This comparison measures the indicator’s values over multiple time periods.<br>The Mann-Kendall Test for Statistical Significance is used to evaluate the trend<br>over 4 to 10 periods of measure, subject to data availability and comparability.
State: Oregon Stroke: Medicare Population
State: Oregon Stroke: Medicare Population
4.0%
(2022)
Compared to:
U.S. States
The distribution is based on data from 50 U.S. states and the District of Columbia.
US Value
(6.0%)
The regional value is compared to the national value.
Prior Value
(4.0%)
Prior Value compares a measured value with the previously measured value. Confidence intervals were not taken into account in determining the direction of the comparison.
Trend
This comparison measures the indicator’s values over multiple time periods.<br>The Mann-Kendall Test for Statistical Significance is used to evaluate the trend<br>over 4 to 10 periods of measure, subject to data availability and comparability.
State: Oregon
Health / Immunizations & Infectious Diseases
Value
Compared to:
State: Oregon Acute Hepatitis B Cases
State: Oregon Acute Hepatitis B Cases
20
Cases
(2021)
Compared to:
Prior Value
(20)
Prior Value compares a measured value with the previously measured value. Confidence intervals were not taken into account in determining the direction of the comparison.
Trend
This comparison measures the indicator’s values over multiple time periods.<br>The Mann-Kendall Test for Statistical Significance is used to evaluate the trend<br>over 4 to 10 periods of measure, subject to data availability and comparability.
State: Oregon Acute Hepatitis C Cases
State: Oregon Acute Hepatitis C Cases
30
Cases
(2021)
Compared to:
Prior Value
(34)
Prior Value compares a measured value with the previously measured value. Confidence intervals were not taken into account in determining the direction of the comparison.
Trend
This comparison measures the indicator’s values over multiple time periods.<br>The Mann-Kendall Test for Statistical Significance is used to evaluate the trend<br>over 4 to 10 periods of measure, subject to data availability and comparability.
State: Oregon Adolescents Up-to-Date on Immunizations: 13-year-old
State: Oregon Adolescents Up-to-Date on Immunizations: 13-year-old
33.0%
(2022)
Compared to:
Prior Value
(33.0%)
Prior Value compares a measured value with the previously measured value. Confidence intervals were not taken into account in determining the direction of the comparison.
State: Oregon Adults 65+ with Influenza Vaccination
State: Oregon Adults 65+ with Influenza Vaccination
54.8%
(2014-2017)
Compared to:
US Value
(67.8% in 2022)
The regional value is compared to the national value. The source for the national value is Behavioral Risk Factor Surveillance System
Prior Value
(55.3%)
Prior Value compares a measured value with the previously measured value. Confidence intervals were taken into account in determining the direction of the comparison.
Trend
This comparison measures the indicator’s values over multiple time periods.<br>The Mann-Kendall Test for Statistical Significance is used to evaluate the trend<br>over 4 to 10 periods of measure, subject to data availability and comparability.
State: Oregon Adults 65+ with Pneumonia Vaccination
State: Oregon Adults 65+ with Pneumonia Vaccination
77.2%
(2014-2017)
Compared to:
US Value
(71.6% in 2022)
The regional value is compared to the national value. The source for the national value is Behavioral Risk Factor Surveillance System
Prior Value
(75.2%)
Prior Value compares a measured value with the previously measured value. Confidence intervals were taken into account in determining the direction of the comparison.
Trend
This comparison measures the indicator’s values over multiple time periods.<br>The Mann-Kendall Test for Statistical Significance is used to evaluate the trend<br>over 4 to 10 periods of measure, subject to data availability and comparability.
State: Oregon Age-Adjusted Death Rate due to Influenza and Pneumonia
State: Oregon Age-Adjusted Death Rate due to Influenza and Pneumonia
9.6
Deaths per 100,000 population
(2015-2017)
Compared to:
US Value
(14.3)
The regional value is compared to the national value. The source for the national value is Centers for Disease Control and Prevention
Prior Value
(9.0)
Prior Value compares a measured value with the previously measured value. Confidence intervals were not taken into account in determining the direction of the comparison.
Trend
This comparison measures the indicator’s values over multiple time periods.<br>The Mann-Kendall Test for Statistical Significance is used to evaluate the trend<br>over 4 to 10 periods of measure, subject to data availability and comparability.
State: Oregon Children Up-to-Date on Immunizations: 2 Years
State: Oregon Children Up-to-Date on Immunizations: 2 Years
69.0%
(2022)
Compared to:
Prior Value
(71.0%)
Prior Value compares a measured value with the previously measured value. Confidence intervals were not taken into account in determining the direction of the comparison.
Trend
This comparison measures the indicator’s values over multiple time periods.<br>The Mann-Kendall Test for Statistical Significance is used to evaluate the trend<br>over 4 to 10 periods of measure, subject to data availability and comparability.
Deschutes RHIP Target
(80%)
<div>RHIP Targets are goals for each county or region as outlined in the <a href="http://www.centraloregonhealthdata.org/content/sites/cohc/RHA_and_RHIP/RHIP_2020_Final.pdf">2020-2023 Central Oregon Regional Health Improvement Plan</a></div>
Crook RHIP Target
(80%)
<div>RHIP Targets are goals for each county or region as outlined in the <a href="http://www.centraloregonhealthdata.org/content/sites/cohc/RHA_and_RHIP/RHIP_2020_Final.pdf">2020-2023 Central Oregon Regional Health Improvement Plan</a></div>
Jefferson RHIP Target
(80%)
<div>RHIP Targets are goals for each county or region as outlined in the <a href="http://www.centraloregonhealthdata.org/content/sites/cohc/RHA_and_RHIP/RHIP_2020_Final.pdf">2020-2023 Central Oregon Regional Health Improvement Plan</a></div>
State: Oregon Chronic Hepatitis B Cases
State: Oregon Chronic Hepatitis B Cases
375
Cases
(2021)
Compared to:
Prior Value
(296)
Prior Value compares a measured value with the previously measured value. Confidence intervals were not taken into account in determining the direction of the comparison.
Trend
This comparison measures the indicator’s values over multiple time periods.<br>The Mann-Kendall Test for Statistical Significance is used to evaluate the trend<br>over 4 to 10 periods of measure, subject to data availability and comparability.
State: Oregon Chronic Hepatitis C Cases
State: Oregon Chronic Hepatitis C Cases
3,848
Cases
(2021)
Compared to:
Prior Value
(3,683)
Prior Value compares a measured value with the previously measured value. Confidence intervals were not taken into account in determining the direction of the comparison.
Trend
This comparison measures the indicator’s values over multiple time periods.<br>The Mann-Kendall Test for Statistical Significance is used to evaluate the trend<br>over 4 to 10 periods of measure, subject to data availability and comparability.
State: Oregon COVID-19 Daily Average Case-Fatality Rate
State: Oregon COVID-19 Daily Average Case-Fatality Rate
1.4
Deaths per 100 cases
(Mar 3, 2023)
Compared to:
U.S. States
The distribution is based on data from 49 U.S. states and the District of Columbia.
US Value
(1.7)
The regional value is compared to the national value.
Prior Value
(1.0)
Prior Value compares a measured value with the previously measured value. Confidence intervals were not taken into account in determining the direction of the comparison.
Trend
This comparison measures the indicator’s values over multiple time periods.<br>The Mann-Kendall Test for Statistical Significance is used to evaluate the trend<br>over 4 to 10 periods of measure, subject to data availability and comparability.
State: Oregon COVID-19 Daily Average Incidence Rate
State: Oregon COVID-19 Daily Average Incidence Rate
7.92
Cases per 100,000 population
(Mar 3, 2023)
Compared to:
U.S. States
The distribution is based on data from 50 U.S. states and the District of Columbia.
US Value
(10.97)
The regional value is compared to the national value.
Prior Value
(8.37)
Prior Value compares a measured value with the previously measured value. Confidence intervals were not taken into account in determining the direction of the comparison.
Trend
This comparison measures the indicator’s values over multiple time periods.<br>The Mann-Kendall Test for Statistical Significance is used to evaluate the trend<br>over 4 to 10 periods of measure, subject to data availability and comparability.
State: Oregon Cryptosporidiosis Cases
State: Oregon Cryptosporidiosis Cases
125
(2021)
Compared to:
Prior Value
(92)
Prior Value compares a measured value with the previously measured value. Confidence intervals were not taken into account in determining the direction of the comparison.
Trend
This comparison measures the indicator’s values over multiple time periods.<br>The Mann-Kendall Test for Statistical Significance is used to evaluate the trend<br>over 4 to 10 periods of measure, subject to data availability and comparability.
State: Oregon Flu Vaccinations: Medicare Population
State: Oregon Flu Vaccinations: Medicare Population
44.0%
(2022)
Compared to:
U.S. States
The distribution is based on data from 50 U.S. states and the District of Columbia.
US Value
(50.0%)
The regional value is compared to the national value.
Prior Value
(43.0%)
Prior Value compares a measured value with the previously measured value. Confidence intervals were not taken into account in determining the direction of the comparison.
Trend
This comparison measures the indicator’s values over multiple time periods.<br>The Mann-Kendall Test for Statistical Significance is used to evaluate the trend<br>over 4 to 10 periods of measure, subject to data availability and comparability.
State: Oregon Giardiasis Cases
State: Oregon Giardiasis Cases
344
Cases
(2021)
Compared to:
Prior Value
(250)
Prior Value compares a measured value with the previously measured value. Confidence intervals were not taken into account in determining the direction of the comparison.
Trend
This comparison measures the indicator’s values over multiple time periods.<br>The Mann-Kendall Test for Statistical Significance is used to evaluate the trend<br>over 4 to 10 periods of measure, subject to data availability and comparability.
State: Oregon Hepatitis A Cases
State: Oregon Hepatitis A Cases
14
Cases
(2021)
Compared to:
Prior Value
(28)
Prior Value compares a measured value with the previously measured value. Confidence intervals were not taken into account in determining the direction of the comparison.
Trend
This comparison measures the indicator’s values over multiple time periods.<br>The Mann-Kendall Test for Statistical Significance is used to evaluate the trend<br>over 4 to 10 periods of measure, subject to data availability and comparability.
State: Oregon Legionellosis Cases
State: Oregon Legionellosis Cases
73
Cases
(2021)
Compared to:
Prior Value
(65)
Prior Value compares a measured value with the previously measured value. Confidence intervals were not taken into account in determining the direction of the comparison.
Trend
This comparison measures the indicator’s values over multiple time periods.<br>The Mann-Kendall Test for Statistical Significance is used to evaluate the trend<br>over 4 to 10 periods of measure, subject to data availability and comparability.
State: Oregon Meningococcal Disease Cases
State: Oregon Meningococcal Disease Cases
6
Cases
(2021)
Compared to:
Prior Value
(11)
Prior Value compares a measured value with the previously measured value. Confidence intervals were not taken into account in determining the direction of the comparison.
Trend
This comparison measures the indicator’s values over multiple time periods.<br>The Mann-Kendall Test for Statistical Significance is used to evaluate the trend<br>over 4 to 10 periods of measure, subject to data availability and comparability.
State: Oregon Pertussis Cases
State: Oregon Pertussis Cases
3
Cases
(2021)
Compared to:
Prior Value
(165)
Prior Value compares a measured value with the previously measured value. Confidence intervals were not taken into account in determining the direction of the comparison.
Trend
This comparison measures the indicator’s values over multiple time periods.<br>The Mann-Kendall Test for Statistical Significance is used to evaluate the trend<br>over 4 to 10 periods of measure, subject to data availability and comparability.
State: Oregon Pneumonia Vaccinations: Medicare Population
State: Oregon Pneumonia Vaccinations: Medicare Population
6.0%
(2022)
Compared to:
U.S. States
The distribution is based on data from 50 U.S. states and the District of Columbia.
US Value
(8.0%)
The regional value is compared to the national value.
Prior Value
(5.0%)
Prior Value compares a measured value with the previously measured value. Confidence intervals were not taken into account in determining the direction of the comparison.
Trend
This comparison measures the indicator’s values over multiple time periods.<br>The Mann-Kendall Test for Statistical Significance is used to evaluate the trend<br>over 4 to 10 periods of measure, subject to data availability and comparability.
State: Oregon Shigellosis Cases
State: Oregon Shigellosis Cases
122
Cases
(2021)
Compared to:
Prior Value
(192)
Prior Value compares a measured value with the previously measured value. Confidence intervals were not taken into account in determining the direction of the comparison.
Trend
This comparison measures the indicator’s values over multiple time periods.<br>The Mann-Kendall Test for Statistical Significance is used to evaluate the trend<br>over 4 to 10 periods of measure, subject to data availability and comparability.
State: Oregon West Nile Virus Cases
State: Oregon West Nile Virus Cases
5
Cases
(2021)
Compared to:
Prior Value
(1)
Prior Value compares a measured value with the previously measured value. Confidence intervals were not taken into account in determining the direction of the comparison.
Trend
This comparison measures the indicator’s values over multiple time periods.<br>The Mann-Kendall Test for Statistical Significance is used to evaluate the trend<br>over 4 to 10 periods of measure, subject to data availability and comparability.
State: Oregon
Health / Maternal, Fetal & Infant Health
Value
Compared to:
State: Oregon Babies with Low Birthweight
State: Oregon Babies with Low Birthweight
6.9%
(2021)
Compared to:
US Value
(8.5%)
The regional value is compared to the national value. The source for the national value is Centers for Disease Control and Prevention
Prior Value
(6.6%)
Prior Value compares a measured value with the previously measured value. Confidence intervals were not taken into account in determining the direction of the comparison.
Trend
This comparison measures the indicator’s values over multiple time periods.<br>The Mann-Kendall Test for Statistical Significance is used to evaluate the trend<br>over 4 to 10 periods of measure, subject to data availability and comparability.
State: Oregon Infant Mortality Rate
State: Oregon Infant Mortality Rate
3.8
Deaths per 1,000 live births
(2021)
Compared to:
US Value
(5.4)
The regional value is compared to the national value. The source for the national value is Centers for Disease Control and Prevention
Prior Value
(4.2)
Prior Value compares a measured value with the previously measured value. Confidence intervals were not taken into account in determining the direction of the comparison.
Trend
This comparison measures the indicator’s values over multiple time periods.<br>The Mann-Kendall Test for Statistical Significance is used to evaluate the trend<br>over 4 to 10 periods of measure, subject to data availability and comparability.
HP 2030 Target
(5.0)
<div>MICH-02: Reduce the rate of infant deaths <strong>(LEADING HEALTH INDICATOR)</strong></div>
State: Oregon Mothers who Received Adequate Prenatal Care: 5+ Visits
State: Oregon Mothers who Received Adequate Prenatal Care: 5+ Visits
94.2%
(2021)
Compared to:
Prior Value
(93.5%)
Prior Value compares a measured value with the previously measured value. Confidence intervals were not taken into account in determining the direction of the comparison.
Trend
This comparison measures the indicator’s values over multiple time periods.<br>The Mann-Kendall Test for Statistical Significance is used to evaluate the trend<br>over 4 to 10 periods of measure, subject to data availability and comparability.
State: Oregon Mothers who Received Early Prenatal Care
State: Oregon Mothers who Received Early Prenatal Care
82.0%
(2021)
Compared to:
US Value
(78.3%)
The regional value is compared to the national value. The source for the national value is Centers for Disease Control and Prevention
Prior Value
(81.8%)
Prior Value compares a measured value with the previously measured value. Confidence intervals were not taken into account in determining the direction of the comparison.
Trend
This comparison measures the indicator’s values over multiple time periods.<br>The Mann-Kendall Test for Statistical Significance is used to evaluate the trend<br>over 4 to 10 periods of measure, subject to data availability and comparability.
State: Oregon Mothers who Smoked During Pregnancy
State: Oregon Mothers who Smoked During Pregnancy
5.6%
(2021)
Compared to:
US Value
(4.6%)
The regional value is compared to the national value. The source for the national value is Centers for Disease Control and Prevention
Prior Value
(6.8%)
Prior Value compares a measured value with the previously measured value. Confidence intervals were not taken into account in determining the direction of the comparison.
Trend
This comparison measures the indicator’s values over multiple time periods.<br>The Mann-Kendall Test for Statistical Significance is used to evaluate the trend<br>over 4 to 10 periods of measure, subject to data availability and comparability.
HP 2030 Target
(4.3%)
State: Oregon
Health / Mental Health & Mental Disorders
Value
Compared to:
State: Oregon Age-Adjusted Death Rate due to Suicide
State: Oregon Age-Adjusted Death Rate due to Suicide
18.2
Deaths per 100,000 population
(2015-2017)
Compared to:
US Value
(13.6)
The regional value is compared to the national value. The source for the national value is Centers for Disease Control and Prevention
Prior Value
(18.1)
Prior Value compares a measured value with the previously measured value. Confidence intervals were not taken into account in determining the direction of the comparison.
Trend
This comparison measures the indicator’s values over multiple time periods.<br>The Mann-Kendall Test for Statistical Significance is used to evaluate the trend<br>over 4 to 10 periods of measure, subject to data availability and comparability.
HP 2030 Target
(12.8)
<div>MHMD-01: Reduce the suicide rate <strong>(LEADING HEALTH INDICATOR)</strong></div>
State: Oregon Depression: Medicare Population
State: Oregon Depression: Medicare Population
16.0%
(2022)
Compared to:
U.S. States
The distribution is based on data from 50 U.S. states and the District of Columbia.
US Value
(16.0%)
The regional value is compared to the national value.
Prior Value
(16.0%)
Prior Value compares a measured value with the previously measured value. Confidence intervals were not taken into account in determining the direction of the comparison.
Trend
This comparison measures the indicator’s values over multiple time periods.<br>The Mann-Kendall Test for Statistical Significance is used to evaluate the trend<br>over 4 to 10 periods of measure, subject to data availability and comparability.
State: Oregon Frequent Mental Distress
State: Oregon Frequent Mental Distress
14.6%
(2019)
Compared to:
U.S. States
The distribution is based on data from 49 U.S. states and the District of Columbia.
US Value
(14.0%)
The regional value is compared to the national value.
Prior Value
(14.8%)
Prior Value compares a measured value with the previously measured value. Confidence intervals were taken into account in determining the direction of the comparison.
State: Oregon Mental Health Provider Rate
State: Oregon Mental Health Provider Rate
677
Providers per 100,000 population
(2023)
Compared to:
U.S. States
The distribution is based on data from 50 U.S. states and the District of Columbia.
Prior Value
(632)
Prior Value compares a measured value with the previously measured value. Confidence intervals were not taken into account in determining the direction of the comparison.
Trend
This comparison measures the indicator’s values over multiple time periods.<br>The Mann-Kendall Test for Statistical Significance is used to evaluate the trend<br>over 4 to 10 periods of measure, subject to data availability and comparability.
State: Oregon Students who have Attempted Suicide: 11th Graders
State: Oregon Students who have Attempted Suicide: 11th Graders
5.0%
(2022)
Compared to:
Prior Value
(5.1%)
Prior Value compares a measured value with the previously measured value. Confidence intervals were not taken into account in determining the direction of the comparison.
Trend
This comparison measures the indicator’s values over multiple time periods.<br>The Mann-Kendall Test for Statistical Significance is used to evaluate the trend<br>over 4 to 10 periods of measure, subject to data availability and comparability.
State: Oregon Students who have Attempted Suicide: 8th Graders
State: Oregon Students who have Attempted Suicide: 8th Graders
5.0%
(2022)
Compared to:
Prior Value
(5.6%)
Prior Value compares a measured value with the previously measured value. Confidence intervals were not taken into account in determining the direction of the comparison.
Trend
This comparison measures the indicator’s values over multiple time periods.<br>The Mann-Kendall Test for Statistical Significance is used to evaluate the trend<br>over 4 to 10 periods of measure, subject to data availability and comparability.
State: Oregon Students who have been Depressed: 11th Graders
State: Oregon Students who have been Depressed: 11th Graders
38.4%
(2022)
Compared to:
Prior Value
(42.9%)
Prior Value compares a measured value with the previously measured value. Confidence intervals were not taken into account in determining the direction of the comparison.
Trend
This comparison measures the indicator’s values over multiple time periods.<br>The Mann-Kendall Test for Statistical Significance is used to evaluate the trend<br>over 4 to 10 periods of measure, subject to data availability and comparability.
State: Oregon Students who have been Depressed: 8th Graders
State: Oregon Students who have been Depressed: 8th Graders
29.8%
(2022)
Compared to:
Prior Value
(33.0%)
Prior Value compares a measured value with the previously measured value. Confidence intervals were not taken into account in determining the direction of the comparison.
Trend
This comparison measures the indicator’s values over multiple time periods.<br>The Mann-Kendall Test for Statistical Significance is used to evaluate the trend<br>over 4 to 10 periods of measure, subject to data availability and comparability.
State: Oregon Students who have Considered Suicide: 11th Graders
State: Oregon Students who have Considered Suicide: 11th Graders
14.6%
(2022)
Compared to:
Prior Value
(16.5%)
Prior Value compares a measured value with the previously measured value. Confidence intervals were not taken into account in determining the direction of the comparison.
Trend
This comparison measures the indicator’s values over multiple time periods.<br>The Mann-Kendall Test for Statistical Significance is used to evaluate the trend<br>over 4 to 10 periods of measure, subject to data availability and comparability.
State: Oregon Students who have Considered Suicide: 8th Graders
State: Oregon Students who have Considered Suicide: 8th Graders
11.6%
(2022)
Compared to:
Prior Value
(14.4%)
Prior Value compares a measured value with the previously measured value. Confidence intervals were not taken into account in determining the direction of the comparison.
Trend
This comparison measures the indicator’s values over multiple time periods.<br>The Mann-Kendall Test for Statistical Significance is used to evaluate the trend<br>over 4 to 10 periods of measure, subject to data availability and comparability.
State: Oregon Unmet Mental Health Care Need Among Students
State: Oregon Unmet Mental Health Care Need Among Students
22.9%
(2022)
Compared to:
Prior Value
(23.6%)
Prior Value compares a measured value with the previously measured value. Confidence intervals were not taken into account in determining the direction of the comparison.
Trend
This comparison measures the indicator’s values over multiple time periods.<br>The Mann-Kendall Test for Statistical Significance is used to evaluate the trend<br>over 4 to 10 periods of measure, subject to data availability and comparability.
State: Oregon
Health / Mortality Data
Value
Compared to:
State: Oregon Years of Potential Life Lost
State: Oregon Years of Potential Life Lost
6,205.7
Per 100,000 population
(2018)
Compared to:
Prior Value
(6,503.8)
Prior Value compares a measured value with the previously measured value. Confidence intervals were not taken into account in determining the direction of the comparison.
Trend
This comparison measures the indicator’s values over multiple time periods.<br>The Mann-Kendall Test for Statistical Significance is used to evaluate the trend<br>over 4 to 10 periods of measure, subject to data availability and comparability.
State: Oregon
Health / Older Adults
Value
Compared to:
State: Oregon Adults 65+ with a Disability
State: Oregon Adults 65+ with a Disability
34.3%
(2022)
Compared to:
Prior Value
(32.5%)
Prior Value compares a measured value with the previously measured value. Confidence intervals were taken into account in determining the direction of the comparison.
Trend
This comparison measures the indicator’s values over multiple time periods.<br>The Mann-Kendall Test for Statistical Significance is used to evaluate the trend<br>over 4 to 10 periods of measure, subject to data availability and comparability.
State: Oregon Adults 65+ with a Hearing Difficulty
State: Oregon Adults 65+ with a Hearing Difficulty
16.2%
(2018-2022)
Compared to:
US Value
(13.7%)
The regional value is compared to the national value.
Trend
This comparison measures the indicator’s values over multiple time periods.<br>The Mann-Kendall Test for Statistical Significance is used to evaluate the trend<br>over 4 to 10 periods of measure, subject to data availability and comparability.
State: Oregon Adults 65+ with a Self-Care Difficulty
State: Oregon Adults 65+ with a Self-Care Difficulty
7.4%
(2018-2022)
Compared to:
US Value
(7.4%)
The regional value is compared to the national value.
Trend
This comparison measures the indicator’s values over multiple time periods.<br>The Mann-Kendall Test for Statistical Significance is used to evaluate the trend<br>over 4 to 10 periods of measure, subject to data availability and comparability.
State: Oregon Adults 65+ with a Vision Difficulty
State: Oregon Adults 65+ with a Vision Difficulty
5.8%
(2018-2022)
Compared to:
US Value
(6.0%)
The regional value is compared to the national value.
Trend
This comparison measures the indicator’s values over multiple time periods.<br>The Mann-Kendall Test for Statistical Significance is used to evaluate the trend<br>over 4 to 10 periods of measure, subject to data availability and comparability.
State: Oregon Adults 65+ with an Independent Living Difficulty
State: Oregon Adults 65+ with an Independent Living Difficulty
13.0%
(2018-2022)
Compared to:
US Value
(13.6%)
The regional value is compared to the national value.
Trend
This comparison measures the indicator’s values over multiple time periods.<br>The Mann-Kendall Test for Statistical Significance is used to evaluate the trend<br>over 4 to 10 periods of measure, subject to data availability and comparability.
State: Oregon Age-Adjusted Death Rate due to Alzheimer's Disease
State: Oregon Age-Adjusted Death Rate due to Alzheimer's Disease
34.1
Deaths per 100,000 population
(2015-2017)
Compared to:
US Value
(30.3)
The regional value is compared to the national value. The source for the national value is Centers for Disease Control and Prevention
Prior Value
(31.8)
Prior Value compares a measured value with the previously measured value. Confidence intervals were not taken into account in determining the direction of the comparison.
Trend
This comparison measures the indicator’s values over multiple time periods.<br>The Mann-Kendall Test for Statistical Significance is used to evaluate the trend<br>over 4 to 10 periods of measure, subject to data availability and comparability.
State: Oregon Alzheimer's Disease or Dementia: Medicare Population
State: Oregon Alzheimer's Disease or Dementia: Medicare Population
5.0%
(2022)
Compared to:
U.S. States
The distribution is based on data from 50 U.S. states and the District of Columbia.
US Value
(6.0%)
The regional value is compared to the national value.
Prior Value
(5.0%)
Prior Value compares a measured value with the previously measured value. Confidence intervals were not taken into account in determining the direction of the comparison.
Trend
This comparison measures the indicator’s values over multiple time periods.<br>The Mann-Kendall Test for Statistical Significance is used to evaluate the trend<br>over 4 to 10 periods of measure, subject to data availability and comparability.
State: Oregon
Health / Oral Health
Value
Compared to:
State: Oregon Dentist Rate
State: Oregon Dentist Rate
85
Dentists per 100,000 population
(2022)
Compared to:
U.S. States
The distribution is based on data from 50 U.S. states and the District of Columbia.
Prior Value
(84)
Prior Value compares a measured value with the previously measured value. Confidence intervals were not taken into account in determining the direction of the comparison.
Trend
This comparison measures the indicator’s values over multiple time periods.<br>The Mann-Kendall Test for Statistical Significance is used to evaluate the trend<br>over 4 to 10 periods of measure, subject to data availability and comparability.
State: Oregon Students who have had a Cavity: 11th Graders
State: Oregon Students who have had a Cavity: 11th Graders
67.5%
(2022)
Compared to:
Prior Value
(62.6%)
Prior Value compares a measured value with the previously measured value. Confidence intervals were not taken into account in determining the direction of the comparison.
Trend
This comparison measures the indicator’s values over multiple time periods.<br>The Mann-Kendall Test for Statistical Significance is used to evaluate the trend<br>over 4 to 10 periods of measure, subject to data availability and comparability.
State: Oregon Students who have had a Cavity: 8th Graders
State: Oregon Students who have had a Cavity: 8th Graders
61.6%
(2022)
Compared to:
Prior Value
(55.6%)
Prior Value compares a measured value with the previously measured value. Confidence intervals were not taken into account in determining the direction of the comparison.
Trend
This comparison measures the indicator’s values over multiple time periods.<br>The Mann-Kendall Test for Statistical Significance is used to evaluate the trend<br>over 4 to 10 periods of measure, subject to data availability and comparability.
69.2%
(2022)
Compared to:
Prior Value
(69.0%)
Prior Value compares a measured value with the previously measured value. Confidence intervals were not taken into account in determining the direction of the comparison.
Trend
This comparison measures the indicator’s values over multiple time periods.<br>The Mann-Kendall Test for Statistical Significance is used to evaluate the trend<br>over 4 to 10 periods of measure, subject to data availability and comparability.
66.8%
(2022)
Compared to:
Prior Value
(66.4%)
Prior Value compares a measured value with the previously measured value. Confidence intervals were not taken into account in determining the direction of the comparison.
Trend
This comparison measures the indicator’s values over multiple time periods.<br>The Mann-Kendall Test for Statistical Significance is used to evaluate the trend<br>over 4 to 10 periods of measure, subject to data availability and comparability.
State: Oregon
Health / Other Conditions
Value
Compared to:
State: Oregon Chronic Kidney Disease: Medicare Population
State: Oregon Chronic Kidney Disease: Medicare Population
14.0%
(2022)
Compared to:
U.S. States
The distribution is based on data from 50 U.S. states and the District of Columbia.
US Value
(18.0%)
The regional value is compared to the national value.
Prior Value
(14.0%)
Prior Value compares a measured value with the previously measured value. Confidence intervals were not taken into account in determining the direction of the comparison.
Trend
This comparison measures the indicator’s values over multiple time periods.<br>The Mann-Kendall Test for Statistical Significance is used to evaluate the trend<br>over 4 to 10 periods of measure, subject to data availability and comparability.
State: Oregon Osteoporosis: Medicare Population
State: Oregon Osteoporosis: Medicare Population
10.0%
(2022)
Compared to:
U.S. States
The distribution is based on data from 50 U.S. states and the District of Columbia.
US Value
(11.0%)
The regional value is compared to the national value.
Prior Value
(10.0%)
Prior Value compares a measured value with the previously measured value. Confidence intervals were not taken into account in determining the direction of the comparison.
Trend
This comparison measures the indicator’s values over multiple time periods.<br>The Mann-Kendall Test for Statistical Significance is used to evaluate the trend<br>over 4 to 10 periods of measure, subject to data availability and comparability.
31.0%
(2022)
Compared to:
U.S. States
The distribution is based on data from 50 U.S. states and the District of Columbia.
US Value
(35.0%)
The regional value is compared to the national value.
Prior Value
(30.0%)
Prior Value compares a measured value with the previously measured value. Confidence intervals were not taken into account in determining the direction of the comparison.
Trend
This comparison measures the indicator’s values over multiple time periods.<br>The Mann-Kendall Test for Statistical Significance is used to evaluate the trend<br>over 4 to 10 periods of measure, subject to data availability and comparability.
State: Oregon
Health / Physical Activity
Value
Compared to:
State: Oregon Adults Engaging in Regular Physical Activity
State: Oregon Adults Engaging in Regular Physical Activity
22.7%
(2014-2017)
Compared to:
Prior Value
(24.4%)
Prior Value compares a measured value with the previously measured value. Confidence intervals were not taken into account in determining the direction of the comparison.
HP 2030 Target
(29.7%)
<div>PA-05: Increase the proportion of adults who do enough aerobic and muscle-strengthening activity <strong>(LEADING HEALTH INDICATOR)</strong></div>
State: Oregon
Health / Prevention & Safety
Value
Compared to:
State: Oregon Age-Adjusted Death Rate due to Falls
State: Oregon Age-Adjusted Death Rate due to Falls
14.5
Deaths per 100,000 population
(2018-2020)
Compared to:
U.S. States
The distribution is based on data from 50 U.S. states and the District of Columbia.
US Value
(9.8)
The regional value is compared to the national value.
Prior Value
(14.5)
Prior Value compares a measured value with the previously measured value. Confidence intervals were taken into account in determining the direction of the comparison.
Trend
This comparison measures the indicator’s values over multiple time periods.<br>The Mann-Kendall Test for Statistical Significance is used to evaluate the trend<br>over 4 to 10 periods of measure, subject to data availability and comparability.
State: Oregon Age-Adjusted Death Rate due to Firearms
State: Oregon Age-Adjusted Death Rate due to Firearms
11.8
Deaths per 100,000 population
(2018-2020)
Compared to:
U.S. States
The distribution is based on data from 50 U.S. states and the District of Columbia.
US Value
(12.0)
The regional value is compared to the national value.
Prior Value
(11.6)
Prior Value compares a measured value with the previously measured value. Confidence intervals were taken into account in determining the direction of the comparison.
Trend
This comparison measures the indicator’s values over multiple time periods.<br>The Mann-Kendall Test for Statistical Significance is used to evaluate the trend<br>over 4 to 10 periods of measure, subject to data availability and comparability.
HP 2030 Target
(10.7)
State: Oregon Age-Adjusted Death Rate due to Unintentional Injuries
State: Oregon Age-Adjusted Death Rate due to Unintentional Injuries
47.2
Deaths per 100,000 population
(2018-2020)
Compared to:
U.S. States
The distribution is based on data from 50 U.S. states and the District of Columbia.
US Value
(51.6)
The regional value is compared to the national value.
Prior Value
(44.8)
Prior Value compares a measured value with the previously measured value. Confidence intervals were taken into account in determining the direction of the comparison.
Trend
This comparison measures the indicator’s values over multiple time periods.<br>The Mann-Kendall Test for Statistical Significance is used to evaluate the trend<br>over 4 to 10 periods of measure, subject to data availability and comparability.
HP 2030 Target
(43.2)
State: Oregon Age-Adjusted Death Rate due to Unintentional Poisonings
State: Oregon Age-Adjusted Death Rate due to Unintentional Poisonings
15.1
Deaths per 100,000 population
(2018-2020)
Compared to:
U.S. States
The distribution is based on data from 50 U.S. states and the District of Columbia.
US Value
(23.5)
The regional value is compared to the national value.
Prior Value
(13.0)
Prior Value compares a measured value with the previously measured value. Confidence intervals were taken into account in determining the direction of the comparison.
Trend
This comparison measures the indicator’s values over multiple time periods.<br>The Mann-Kendall Test for Statistical Significance is used to evaluate the trend<br>over 4 to 10 periods of measure, subject to data availability and comparability.
State: Oregon
Health / Respiratory Diseases
Value
Compared to:
40.2
Deaths per 100,000 population
(2015-2017)
Compared to:
US Value
(41.0)
The regional value is compared to the national value. The source for the national value is Centers for Disease Control and Prevention
Prior Value
(40.5)
Prior Value compares a measured value with the previously measured value. Confidence intervals were not taken into account in determining the direction of the comparison.
Trend
This comparison measures the indicator’s values over multiple time periods.<br>The Mann-Kendall Test for Statistical Significance is used to evaluate the trend<br>over 4 to 10 periods of measure, subject to data availability and comparability.
State: Oregon Asthma: Medicare Population
State: Oregon Asthma: Medicare Population
6.0%
(2022)
Compared to:
U.S. States
The distribution is based on data from 50 U.S. states and the District of Columbia.
US Value
(7.0%)
The regional value is compared to the national value.
Prior Value
(6.0%)
Prior Value compares a measured value with the previously measured value. Confidence intervals were not taken into account in determining the direction of the comparison.
Trend
This comparison measures the indicator’s values over multiple time periods.<br>The Mann-Kendall Test for Statistical Significance is used to evaluate the trend<br>over 4 to 10 periods of measure, subject to data availability and comparability.
State: Oregon COPD: Medicare Population
State: Oregon COPD: Medicare Population
9.0%
(2022)
Compared to:
U.S. States
The distribution is based on data from 50 U.S. states and the District of Columbia.
US Value
(11.0%)
The regional value is compared to the national value.
Prior Value
(9.0%)
Prior Value compares a measured value with the previously measured value. Confidence intervals were not taken into account in determining the direction of the comparison.
Trend
This comparison measures the indicator’s values over multiple time periods.<br>The Mann-Kendall Test for Statistical Significance is used to evaluate the trend<br>over 4 to 10 periods of measure, subject to data availability and comparability.
State: Oregon
Health / Sexually Transmitted Infections
Value
Compared to:
State: Oregon 5-Year Gonorrhea Rate per 100,000: Age-Adjusted
State: Oregon 5-Year Gonorrhea Rate per 100,000: Age-Adjusted
141.1
Per 100,000 population
(2016-2020)
Compared to:
Prior Value
(126.5)
Prior Value compares a measured value with the previously measured value. Confidence intervals were not taken into account in determining the direction of the comparison.
Trend
This comparison measures the indicator’s values over multiple time periods.<br>The Mann-Kendall Test for Statistical Significance is used to evaluate the trend<br>over 4 to 10 periods of measure, subject to data availability and comparability.
State: Oregon Age-Adjusted HIV Case Rate per 100,000 population
State: Oregon Age-Adjusted HIV Case Rate per 100,000 population
5.17
(2016-2020)
Compared to:
Prior Value
(5.46)
Prior Value compares a measured value with the previously measured value. Confidence intervals were not taken into account in determining the direction of the comparison.
State: Oregon Chlamydia Incidence Rate
State: Oregon Chlamydia Incidence Rate
367.3
Cases per 100,000 population
(2021)
Compared to:
U.S. States
The distribution is based on data from 42 U.S. states and the District of Columbia.
US Value
(495.5)
The regional value is compared to the national value.
Prior Value
(376.0)
Prior Value compares a measured value with the previously measured value. Confidence intervals were not taken into account in determining the direction of the comparison.
Trend
This comparison measures the indicator’s values over multiple time periods.<br>The Mann-Kendall Test for Statistical Significance is used to evaluate the trend<br>over 4 to 10 periods of measure, subject to data availability and comparability.
State: Oregon Gonorrhea Incidence Rate
State: Oregon Gonorrhea Incidence Rate
146.5
Cases per 100,000 population
(2021)
Compared to:
U.S. States
The distribution is based on data from 49 U.S. states and the District of Columbia.
US Value
(214.0)
The regional value is compared to the national value.
Prior Value
(152.0)
Prior Value compares a measured value with the previously measured value. Confidence intervals were not taken into account in determining the direction of the comparison.
Trend
This comparison measures the indicator’s values over multiple time periods.<br>The Mann-Kendall Test for Statistical Significance is used to evaluate the trend<br>over 4 to 10 periods of measure, subject to data availability and comparability.
